
Sources are linked in full at the end of this article. Nothing here is from a social-media post.
1The short version
A "massive Kelvin wave" has been in the headlines for three weeks. The phrase is real oceanography, but it has been illustrated with photographs of breaking surf, and that is not what a Kelvin wave is. A Kelvin wave is not a wave you can see, not a wall of water, and not a tsunami. It is a slow bulge of warm water, thousands of miles long, that raises the level the ocean sits at. It arrives over weeks, not in a moment, and it leaves the same way.
What it does is simple and worth taking seriously: it lifts the baseline that every tide and every swell rides on top of. A foot of extra ocean under a 7-foot high tide and a long-period south swell is the difference between a wet parking lot and a flooded one, and between a beach that holds and a beach that goes. That combination is already on the forecast for Ventura and Los Angeles County beaches this week.
2What a Kelvin wave actually is
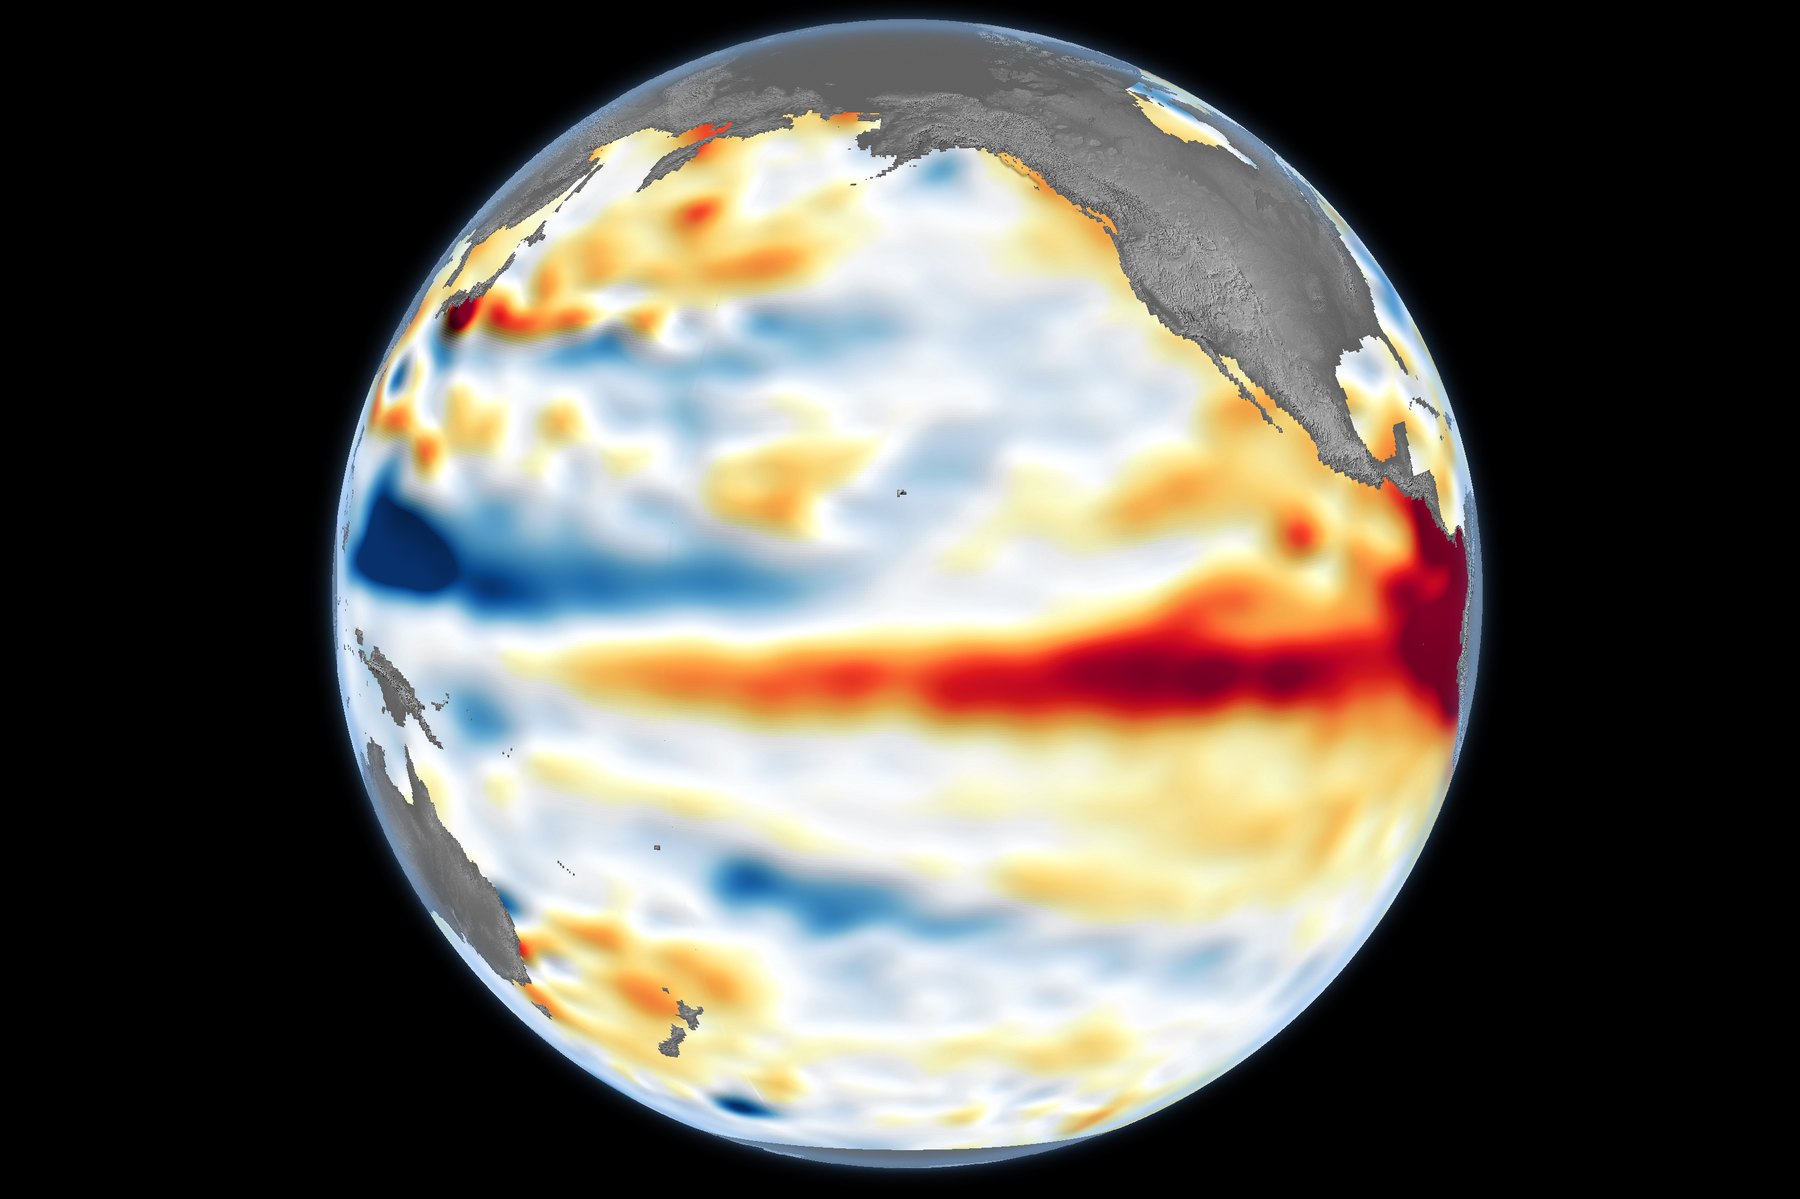
In a normal year the trade winds blow from east to west along the equator and pile warm water up in the western Pacific. During El Niño those winds weaken and periodically reverse in what forecasters call westerly wind bursts. Each burst releases some of that piled-up warm water, which slides back east along the equator as an oceanic Kelvin wave. NOAA Fisheries describes the next step: after reaching Central and South America, the energy turns and travels north as a coastally trapped wave along the North American coast, past Baja, Southern California, Central California and on toward the Pacific Northwest.
Michelle L'Heureux of NOAA's Climate Prediction Center put it this way years ago, and it has not been improved on: unlike the waves at the beach, Kelvin waves do not curl over and crash. They are more like the water in a bathtub, which slowly sloshes. They have broad peaks and valleys that change the depth of the water, and the ocean's word for that depth is sea surface height.
Dillon Amaya, a marine scientist at North Carolina State University who has studied these events, described the coastal version to ABC7 as a bulging of the nearest 20 to 30 kilometres of ocean that propagates up the coastline. There is no mass of water travelling with it. What travels is a signal, and the signal is an elevated sea state.
3Where it is right now
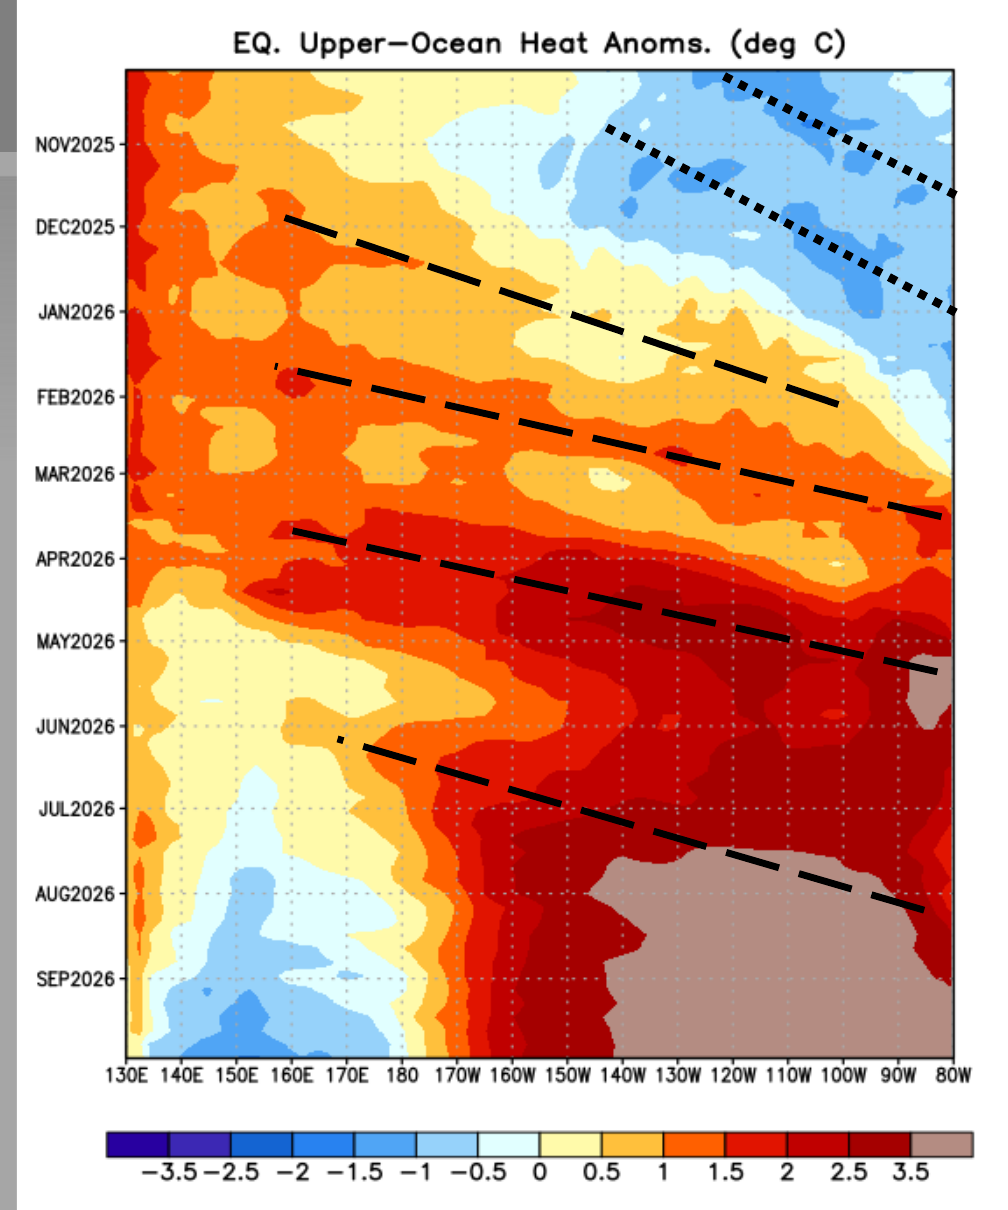
Two sets of government instruments track this, and both are public. The first is NOAA's array of equatorial buoys and satellites, which the Climate Prediction Center summarises every week. Its briefing of 5 October 2026 lists four warm (downwelling) Kelvin waves launched this cycle, in December 2025, January, March and June 2026, and shows subsurface water in the eastern Pacific running 6 to 8 °C above normal at depth, and the Center's September discussion noted anomalies in excess of +10 °C. That is the reservoir the coastal waves draw on.
The second set of instruments is the one that matters on our beaches: NOAA's tide gauges. Every gauge publishes the water level it observes alongside the level the tide tables predicted from the sun and moon alone. The difference is everything the astronomy did not account for: the warm, expanded water of this summer's marine heatwave, weather, and now the coastal Kelvin wave. We pulled that difference for four Southern California stations since 1 June.
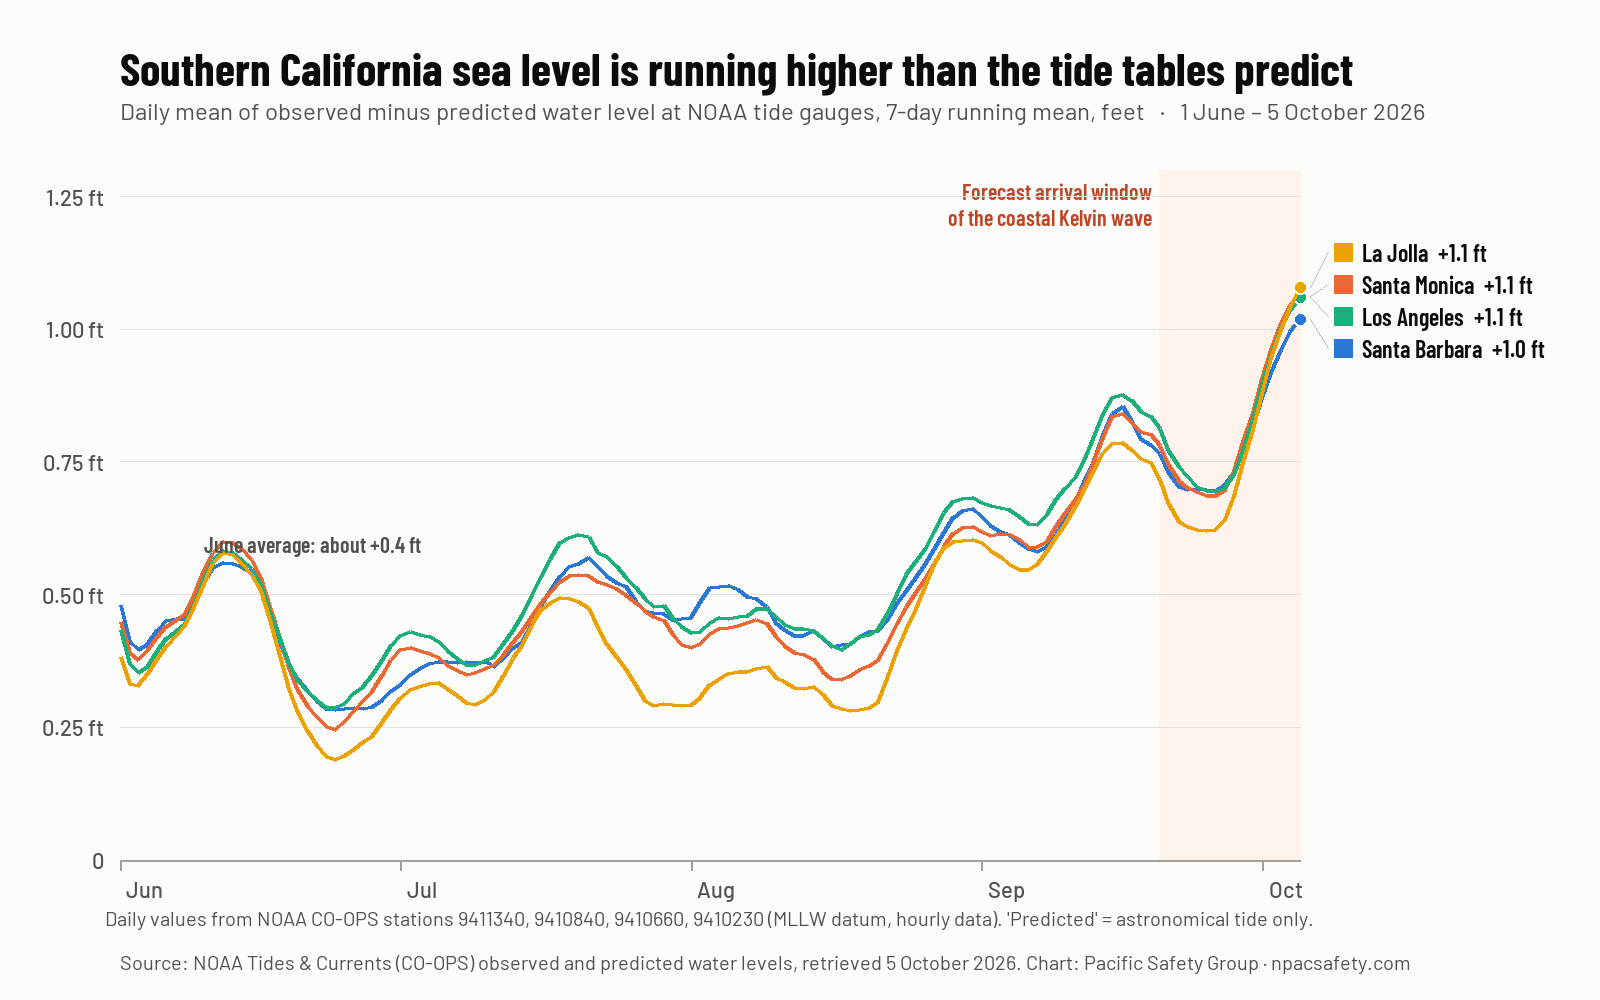
That lines up with what the people who study this have been saying. Daniel Swain of UC Agriculture and Natural Resources noted on 29 September that tides were already running a foot or more above average because of the marine heatwave, with more elevation likely as the largest coastally trapped Kelvin wave of the sequence so far arrives in October. The National Weather Service in San Diego noted in an early-September coastal flood advisory that actual tide levels had been running roughly six inches higher than predicted. Amaya expects three or four more coastal waves through the fall and winter and does not expect levels to settle until spring 2027.
4What it means on the sand
A foot of water does not sound like much until you remember that coastal flooding is a game of margins stacked on margins. Three things stack on top of the Kelvin wave this season:
- The highest tides of the year. California's king tides fall from November to January, and this winter's full moons in late November and December are supermoons. September and October tides are among the lowest of the year, which is the only reason the current foot of extra water has not made bigger news yet.
- Long-period swell. This is the piece lifeguards watch. A big south or west swell on a normal tide runs up the beach; the same swell on a raised baseline runs over the berm, into parking lots, harbor walkways and bike paths. The National Weather Service in Oxnard has already issued a Coastal Flood Advisory for Ventura County beaches, the Malibu coast, Los Angeles County beaches and the islands from Wednesday 7 October through Friday 9 October, for south swell from Hurricane Rachel on 6.5 to 7 ft high tides, with 7-ft-plus tides and combined south and west swell expected the following weekend.
- A coast with less sand than it used to have. The U.S. Geological Survey's study of the 2015–16 El Niño found 79 percent of Southern California beaches eroded that winter, by an average of almost 10 metres, and Central California beaches by far more. Those beaches have not all recovered. William Sweet, NOAA's high-tide-flooding specialist, calls the combination a double whammy: decades of sea level rise has water near the brim, and a strong El Niño is the second punch.
The raised baseline does not make the surf bigger. It makes the surf reach further. Rip currents form in places they did not form at this tide last year. Rock jetties and low walls that are usually dry get overtopped. Sand that was safe to stand on gets undercut. Check the posted hazard before you go in, swim near an occupied lifeguard tower, and if the Weather Service has a Beach Hazards Statement or Coastal Flood Advisory up, treat that as the final word. The live board on our home page carries both.
5What it is not
Three claims are circulating that the data do not support.
It is not a surge that hits on a date
There will be no moment when the Kelvin wave arrives. It quietly raises the baseline for weeks or months. The sharp rise at the right of Figure 3 took about ten days, and it is the baseline that rose, not any individual wave.
It does not flood anything on its own
Twelve inches of additional ocean on a low October tide with no swell floods nothing. Flooding needs the stack: the raised baseline, a high tide and a swell or a storm, together. That is why the Weather Service advisories matter more than the Kelvin wave itself.
It is not the storm forecast
The Kelvin wave is about the ocean's level. Whether this winter brings the rain and wind that many people expect from a very strong El Niño is a separate question, and the historical record on that is more mixed than the headlines. We wrote that up in our El Niño analysis in September, and nothing since has changed the conclusion.
6What to watch, and where
- NWS Los Angeles/Oxnard coastal hazard messages. Beach Hazards Statements and Coastal Flood Advisories are issued for Ventura and Los Angeles County beaches by name. They appear automatically on the live board on our home page and in the hazards strip on the Articles page.
- NOAA's Coastal Inundation Dashboard for real-time and forecast water levels at the Santa Barbara, Santa Monica and Los Angeles gauges, with the observed-minus- predicted difference shown directly.
- The NOAA Climate Prediction Center monthly ENSO discussion. The next is due Thursday 8 October 2026. Our El Niño Watch panel updates from it automatically.
- The king tide dates, published by the California King Tides Project and NOAA each autumn. Those are the days the Kelvin wave stops being invisible.
7Sources
- NOAA Climate Prediction Center — ENSO: Recent Evolution, Current Status and Predictions, 5 October 2026 (Kelvin wave and subsurface figures); ENSO Diagnostic Discussion, 10 September 2026.
- NOAA Tides & Currents (CO-OPS) — observed and predicted water levels, stations 9411340, 9410840, 9410660, 9410230, retrieved 5 October 2026; Coastal Inundation Dashboard.
- National Weather Service Los Angeles/Oxnard — Coastal Hazard Message and Area Forecast Discussion, 5 October 2026.
- NOAA Fisheries — Ocean Indicators We're Tracking for El Niño's Arrival on the West Coast, 3 September 2026 (Nate Mantua, Michael Jacox).
- NOAA National Ocean Service — El Niño and High Tide Flooding, 15 May 2026 (William Sweet).
- NASA Earth Observatory — El Niño Is Underway, 18 June 2026; NASA JPL — International Sea Level Satellite Observes El Niño Precursor, 2 June 2026.
- NOAA Climate.gov ENSO Blog — Michelle L'Heureux, on Kelvin waves (2015), as quoted in Marshall Shepherd, Forbes, 15 September 2026.
- Barnard, P. et al. (2017), Nature Communications 8:14365; Smith, K. & Barnard, P. (2021), USGS, Geomorphology.
- Interviews reported by ABC7 San Francisco (Dillon Amaya, NC State), Gizmodo, 29 September 2026 (Daniel Swain, UC ANR); U.S. News, 1 October 2026; NWS San Diego Coastal Flood Advisory, 7 September 2026.