
NOAA Climate Prediction Center, 8 October 2026 · IRI, 21 September 2026.
This article was first published on 7 September. NOAA's October discussion, issued 8 October, has since raised the odds and the numbers: the Jul–Sep index crossed the +2.0 "very strong" line at +2.2, the chance of a historic Oct–Dec event rose from 69 to 83 percent, and every one of the 22 models in IRI's survey now calls for a very strong event through winter. The figures, the table and the sources below are updated. The analysis of what that does and does not mean for Southern California has not changed, and neither has the conclusion.
1Where the event stands
An El Niño Advisory is in effect. In its diagnostic discussion of 8 October 2026, NOAA's Climate Prediction Center stated that El Niño continues to strengthen, with a strong-to-very strong event likely through January–March 2027 at a greater than 83 percent chance, and sea-surface temperature anomalies exceeding +4.0 °C in portions of the eastern equatorial Pacific. Subsurface temperatures remain more than +10 °C above normal at depth in the eastern Pacific.
The latest weekly sea-surface temperature departures published by CPC show something worth pausing on — the warmth is heavily concentrated in the eastern Pacific:
| Monitoring region | Latest weekly departure | What it covers |
|---|---|---|
| Niño 1+2 | +4.5 °C | Far eastern Pacific, off South America |
| Niño 3 | +3.3 °C | Eastern Pacific |
| Niño 3.4 | +2.3 °C | The standard monitoring region |
| Niño 4 | +0.1 °C | Western/central Pacific — essentially neutral |
Latest weekly departures as published in CPC's ENSO status update of 5 October 2026. A month earlier (31 August) they were +3.5, +2.6, +1.8 and +0.1: the east has warmed a full degree, the west has not moved.
That spread — very warm in the far east, neutral in the west — is the signature of an eastern-Pacific El Niño. It is the same spatial pattern as 1982–83, 1997–98 and 2023–24, and it is not the pattern of 2015–16. Keep that in mind; it matters a great deal by the end of this article.
The model consensus is unusually tight. The International Research Institute for Climate and Society's September Quick Look puts El Niño probability at 100 percent from September–November 2026 through February–April 2027, 99 percent for March–May 2027 and 90 percent for April–June. All 22 models in its survey, 13 dynamical and 9 statistical, forecast very strong conditions (Niño-3.4 at or above +2.0 °C) from September–November through the December–February peak, which IRI says could rank among the strongest events on record.
2How fast it built
The speed of the onset is the part most coverage has missed. This time last year the Pacific was heading the other way.
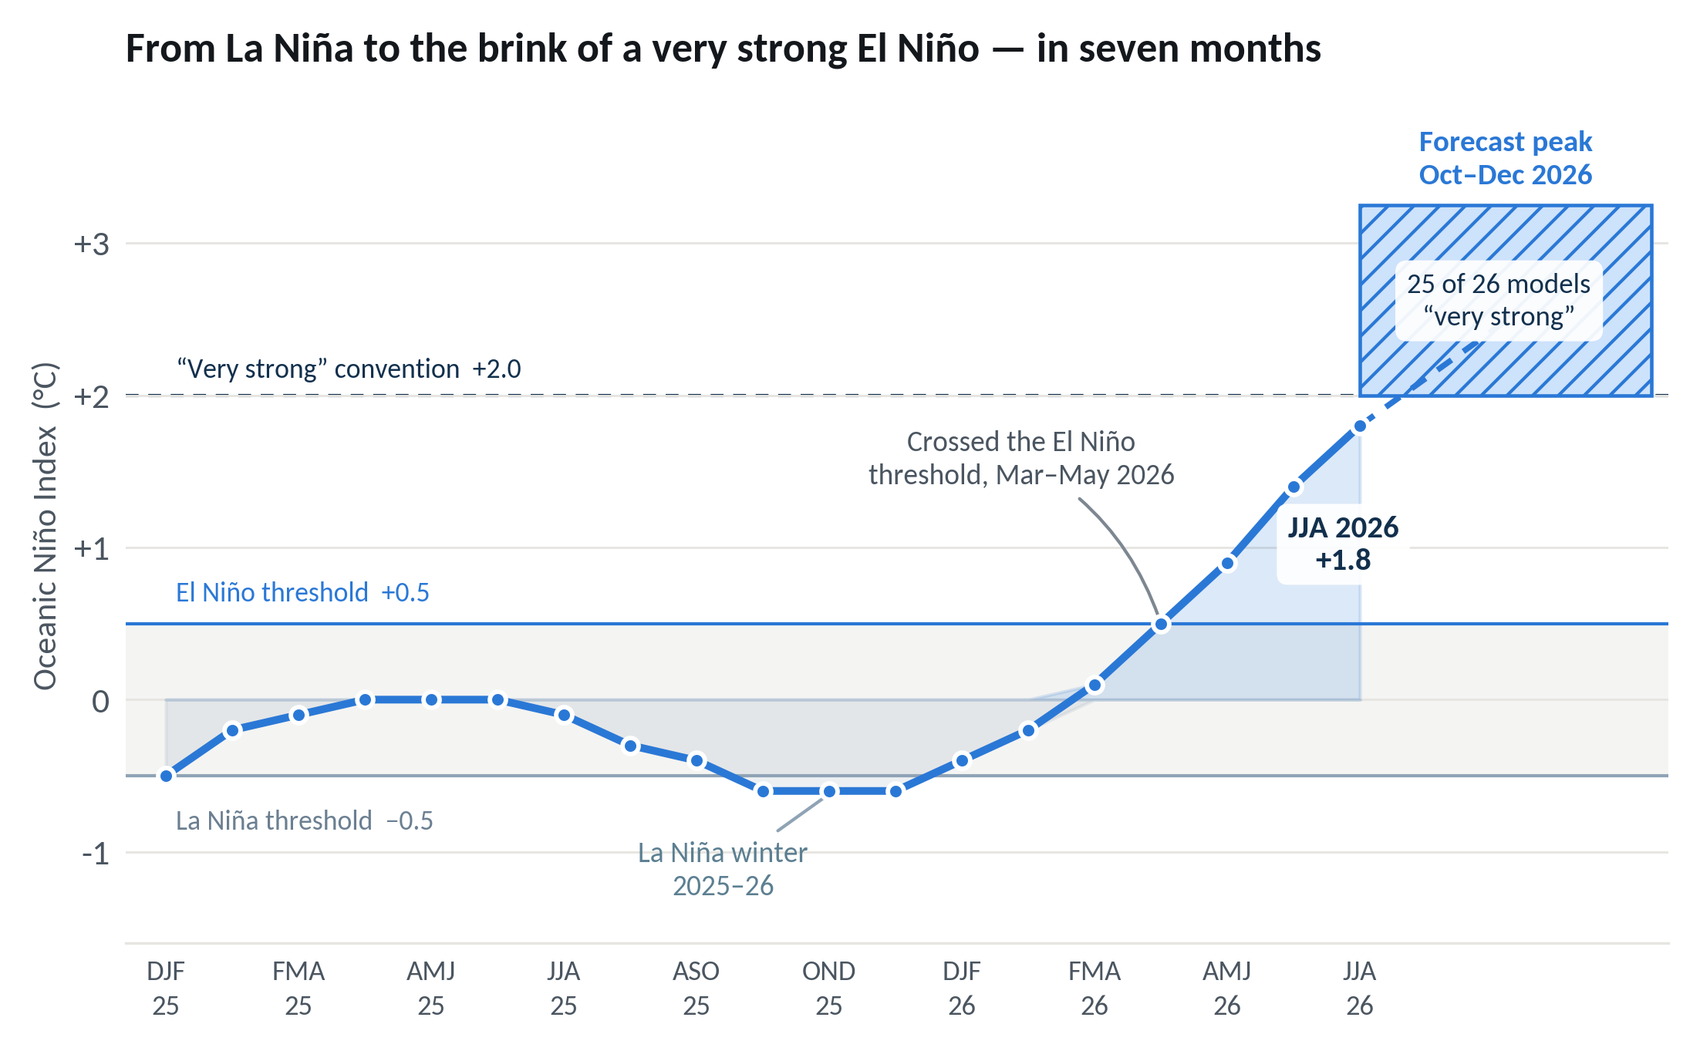
Seven months separate a La Niña winter from the brink of a very strong El Niño. Rapid transitions like this are not unprecedented, but they compress the time available to prepare — and they tend to arrive faster than public messaging adjusts.
3A necessary word about the index
Almost every number you will read about El Niño strength is an Oceanic Niño Index value: the three-month average sea-surface temperature anomaly in the Niño-3.4 region, measured against a thirty-year baseline. NOAA officially defines El Niño as five consecutive overlapping seasons at or above +0.5 °C.
The familiar tiers — weak, moderate, strong, very strong at +0.5, +1.0, +1.5 and +2.0 — are a widely used convention rather than an official NOAA classification. They come from Golden Gate Weather Services and have become the common vocabulary. Worth knowing, because it means "very strong" is a label with a soft edge, not a defined regulatory threshold.
There is a deeper problem with the raw index, and in February 2026 NOAA acted on it.
The traditional Oceanic Niño Index (ONI) relies on a departure from a 30-year average that struggles to keep pace with anomalous changes in tropical sea surface temperature… RONI solves this problem by comparing the ENSO region to the global tropics, thereby reducing the dependency on the climate base period. NOAA Climate Prediction Center, on adopting the Relative Oceanic Niño Index
In plain terms: the entire tropical ocean has warmed. An anomaly measured against a lagging baseline therefore looks bigger than the actual El Niño signal. The Relative ONI subtracts the average anomaly across the whole tropical belt (20°S–20°N) and leaves what is genuinely El Niño.
CPC's 83 percent chance of a "historic" event in October–December (54 percent for September–November, 70 percent for November–January) refers to a three-month RONI value of +2.5 °C or more — not the ONI. Anyone quoting it as "an 83 percent chance the ONI passes +2.5" has the wrong index. The gap is visible in the latest published season: Jul–Sep 2026 is +2.2 on the ONI and +1.7 on the RONI. Because RONI runs roughly half a degree below ONI, the historic threshold corresponds to an ONI around +3.0 — which would be above anything in the record.
4So — are El Niños getting stronger?
This is where the raw index and the corrected one part company, and it is the most interesting thing in the data.
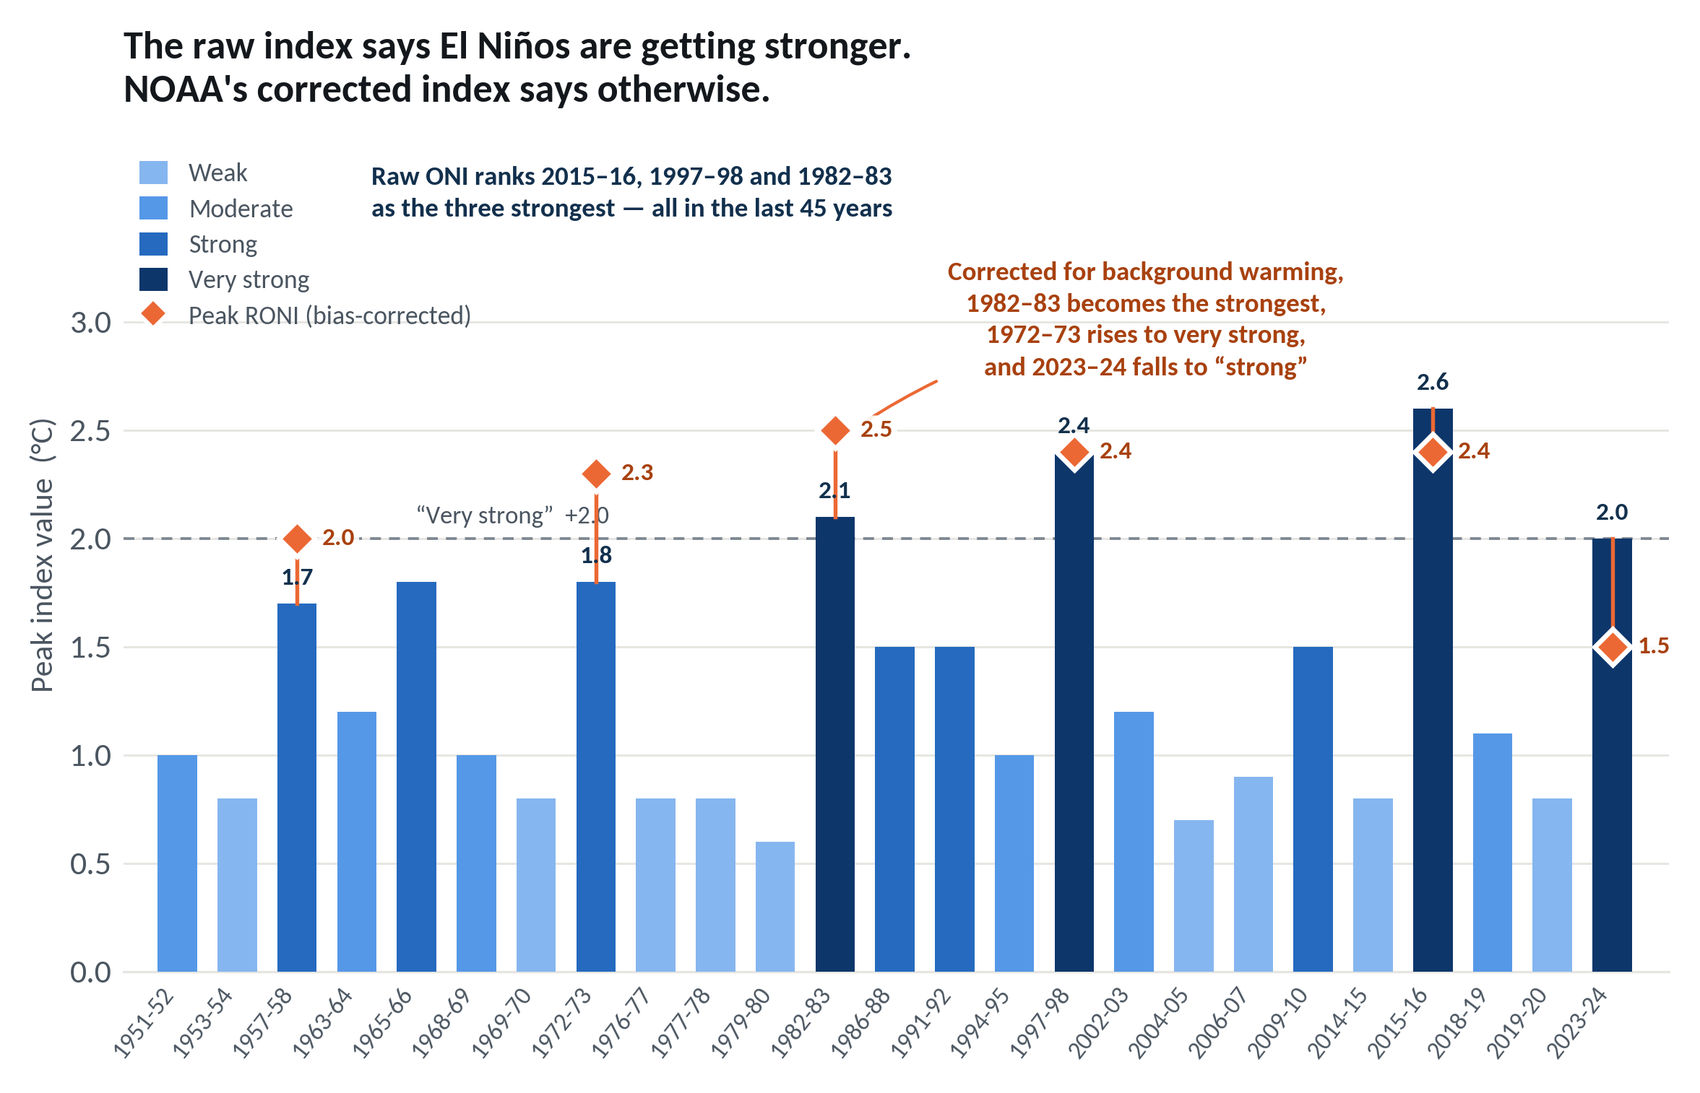
Look at the raw bars alone and the conclusion seems obvious: El Niño events have been getting stronger, and the three biggest all happened recently. That is the version that usually makes the news.
Now look at the diamonds. Once the background ocean warming is removed, the apparent trend largely dissolves. The correction lifts the older events and lowers the recent ones. The strongest El Niño on the corrected record is no longer 2015–16 but 1982–83, at +2.5. The 1972–73 event — which the raw index files as merely "strong" at +1.8 — rises to +2.3 and joins the very strong tier. And 2023–24, reported everywhere as a very strong El Niño, drops from +2.0 to +1.5.
The scientific literature is consistent with this, and it draws a distinction that most coverage collapses. The IPCC's Sixth Assessment Report is explicit about El Niño's temperature amplitude:
There is no model consensus for a systematic change in intensity of ENSO sea surface temperature variability over the 21st century in any of the SSP scenarios assessed (medium confidence). IPCC AR6, Working Group I, Chapter 4
But about El Niño's rainfall behaviour, the same chapter is confident in the opposite direction:
It is very likely that ENSO rainfall variability… will increase significantly, regardless of amplitude changes in ENSO SST variability, by the second half of the 21st century. IPCC AR6, Working Group I, Chapter 4
The widely cited work of Cai and colleagues projecting a doubling of extreme El Niño events defines "extreme" by the reorganisation of atmospheric convection and rainfall — not by a sea-surface temperature threshold. So that finding and the IPCC's "no consensus on SST amplitude" are not in conflict. They are measuring different things.
The defensible statement is therefore not "El Niños are getting stronger." It is: the ocean signal is not clearly intensifying, but the atmospheric impacts that run through it very likely are. That is a more useful sentence for anyone planning around one.
5What El Niño actually does to rainfall
For Southern California, the relationship is real, useful, and routinely oversold.
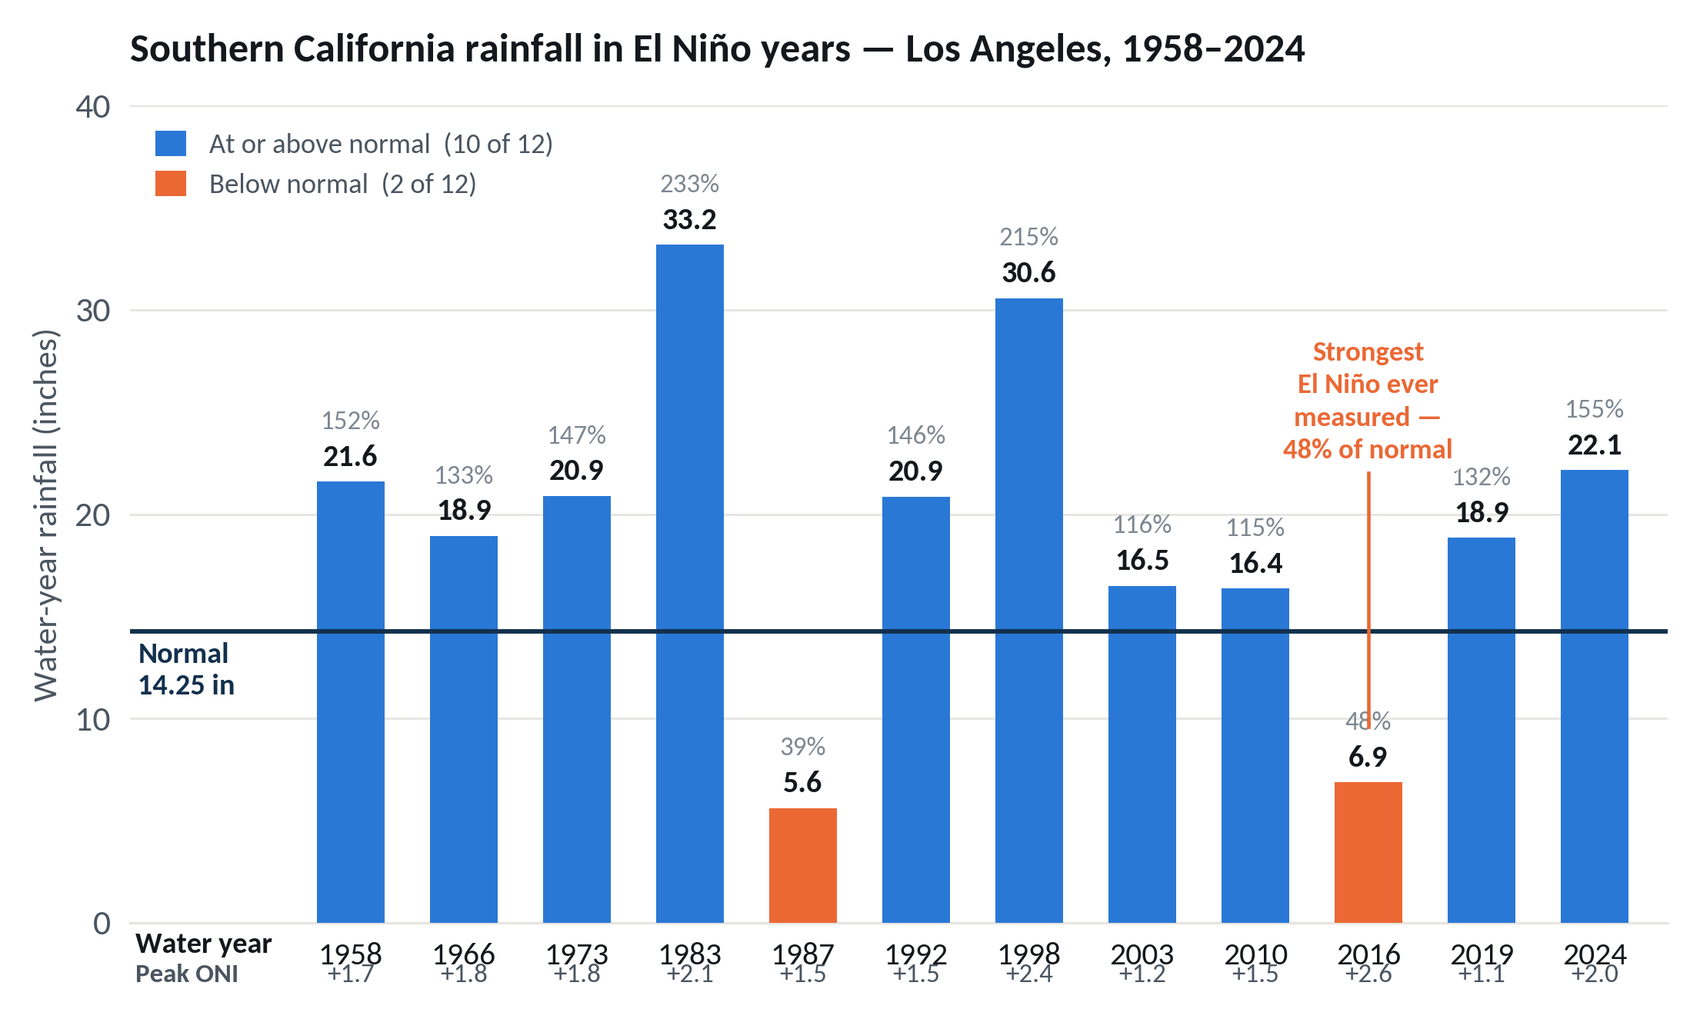
Ten of twelve is a meaningful tilt. It is not a forecast. And the two misses are the instructive part:
- Water year 1987 — a strong El Niño delivered 5.61 inches, 39 percent of normal.
- Water year 2016 — the strongest El Niño ever measured, peak ONI +2.6, delivered 6.88 inches. Forty-eight percent of normal.
Note also that event strength and rainfall do not line up in any orderly way. The very strong events produced both the wettest years in the set (1983 at 233 percent, 1998 at 215 percent) and the driest. Plotted against peak ONI, these totals form no trend at all.
6What it does to the coast
The oceanographic signal is more reliable than the rainfall signal, and it arrives earlier. It is also the part most people overlook, because it does not look like weather.
- Large-surf events run roughly 3.5 times more frequent. The foundational study found storms generating deep-water waves above 10 feet occurred 1.58 times per year in El Niño winters against 0.45 in other years — significant at the 1 percent level. Every storm with a peak wave period above 20 seconds occurred in an ENSO year.
- Wave energy climbs sharply. Mean winter wave energy flux along the California coast ran 50 percent above normal in 2015–16 and 61 percent above normal in 1997–98 — the highest on record.
- Coastal erosion follows. Statewide winter shoreline retreat in 2015–16 was 76 percent above normal, with Southern California beaches averaging nearly 10 metres of erosion and 79 percent of beaches eroding.
- Sea level itself rises along the West Coast during El Niño, and it peaks in October–December — before the storm season, not during it.
A wet El Niño erodes beaches hard but flushes river sediment to the coast, and the beaches rebuild. A dry El Niño — 2015–16 — delivers the wave energy without the sand. Beaches are stripped and recovery is slow, which leaves less protective beach width going into the following winter. The dry scenario is not the harmless one for the coast. In some respects it is the worse one.
7What El Niño does not do
Three things are worth stating plainly, because each one has caught planners out before.
It does not guarantee a wet winter
2015–16 is the standing rebuttal. Two peer-reviewed explanations compete — one attributing the failure to record-warm Indian Ocean and western Pacific temperatures that displaced the storm track north, the other arguing the seasonal signal was simply overwritten by subseasonal variability. Either way the lesson is the same: the seasonal signal can be entirely overwritten at the timescale on which storms actually happen.
It does not act alone
Analysis of the extreme February 2024 rainfall found El Niño was necessary but not sufficient. It set a permissive background state; the flooding required an exceptionally long-lived Madden–Julian Oscillation event interacting with the North Pacific jet for more than three weeks. El Niño loads the dice. Something else still has to throw them.
Seasonal rainfall totals do not predict damage
This is the least intuitive finding in the record. California's costliest flood seasons are not its El Niño seasons. In one widely used compilation, the 1996–97 season — which occurred in cool-neutral conditions — caused roughly $2.94 billion in California flood damage. The very strong 1997–98 El Niño that followed produced nearly double normal rainfall and roughly $0.86 billion, the least damaging of the thirteen costliest seasons in that set, because the rain fell across nearly double the normal number of rain days.
Damage is driven by rainfall intensity and storm clustering, not by seasonal total. An inch of rain in an hour matters more than thirty inches across a season. Anyone tracking season-to-date accumulation as a proxy for risk is watching the wrong number.
8What to watch this winter
- The monthly CPC ENSO discussion, issued on the second Thursday of each month. The next is 12 November 2026. Our El Niño Watch panel updates from it automatically.
- The October–December window, when the event is projected to peak and when West Coast sea level runs highest.
- February and March, which historically carry the highest probability of the season-defining rainfall in Southern California — later than most people expect, and after many organisations have relaxed their posture.
- Short-duration rainfall rates rather than seasonal totals. The National Weather Service puts the onset of urban flooding near an inch per hour, and around half an inch per hour over a recent burn area.
- The distinction between ONI and RONI in anything you read this winter. It will separate careful reporting from the rest.
9Sources
- NOAA Climate Prediction Center — ENSO Diagnostic Discussions of 13 August, 10 September and 8 October 2026; ENSO status updates of 31 August and 5 October 2026; Oceanic Niño Index table (ERSST v6) and Relative Oceanic Niño Index table, both retrieved 9 October 2026; RONI adoption announcement, February 2026.
- International Research Institute for Climate and Society — ENSO Quick Look, 19 August and 21 September 2026.
- NOAA National Centers for Environmental Information — GHCN-Daily, Los Angeles Downtown (USW00093134); 1991–2020 Climate Normals.
- IPCC, Sixth Assessment Report, Working Group I, Chapter 4 (§4.3.3).
- Cai, W. et al. (2014). Increasing frequency of extreme El Niño events due to greenhouse warming. Nature Climate Change 4, 111–116.
- Seymour, R., Strange, R., Cayan, D. & Nathan, R. (1984). Influence of El Niños on California's wave climate. Proc. 19th International Conference on Coastal Engineering.
- Barnard, P. et al. (2017). Extreme oceanographic forcing and coastal response due to the 2015–2016 El Niño. Nature Communications 8:14365.
- Smith, K. & Barnard, P. (2021). The impacts of the 2015/2016 El Niño on California's sandy beaches. Geomorphology.
- Siler, N. et al. (2017), Journal of Climate; Zhang, T. et al. (2018), Journal of Climate 31(2); Mazza, E. et al. (2025), npj Climate and Atmospheric Science 8(1).
- Golden Gate Weather Services — ENSO intensity convention and California flood damage compilation. Private compilation; methodology unpublished.